
The Bureaucratization of the Federal Government, in Fifteen Charts
Mapping the rise of managers and administrators in the federal workforce

Bureaucracy has few fans. Doug McMillon, CEO of Walmart, calls bureaucracy a “villain.” Jamie Dimon, chairman and CEO of JP Morgan Chase, labels it “a disease” and “the enemy within.” In a speech delivered the day before 9/11, then-secretary of Defense Donal Rumsfeld also declared war on Pentagon bureaucracy, saying that it was a threat to national security and “a matter of life and death.” These leaders understood that bureaucracy’s top-down power structures and rule-choked processes sap initiative, inhibit risk taking, mute accountability, and crush creativity. It’s a tax on human achievement.
With enemies like these, you’d think bureaucracy would be on the run, but that’s not the case. Over the last twenty years, growth in management and administrative roles accounted for a whopping 40 percent of US job gains. Public institutions - from government agencies to K-12 schools, universities, research labs and hospitals - have seen even steeper increases. Here we'll examine how this dynamic has played out in the federal workforce, using fifteen handy charts.
Important distinction: 'bureaucrat' doesn't mean 'government employee'. There's a big difference between those doing operational work such as FBI agents, park rangers, software developers, or research scientists — and those whose job it is to manage, monitor, and mediate their work. My focus is on people in management and administrative staff functions such as HR, Finance, Legal, Contracting, and Program Management. In my work with large organizations, this has proven to be a reliable proxy for the bureaucratic footprint. As these roles multiply, they create an ever-expanding web of layers, silos, rules, and processes.
Overall trends
ONE. Forty percent of federal employees are managers or administrators. This includes 250,000 managers, or fifteen percent of the workforce. Non-managerial staff in HR, Finance, Legal, Contracting, and Program Management, and other related support functions make up a quarter of federal employment. The largest administrative category, “Other Administration and Program” is a catch-all that includes administrative officers, program specialists, project managers, cost analysts, coordinators, and similar roles. (Note: these numbers exclude the Department of Veteran Affairs and a few other agencies, as well as part-time roles—see the methodology section at the end of this essay for details.)
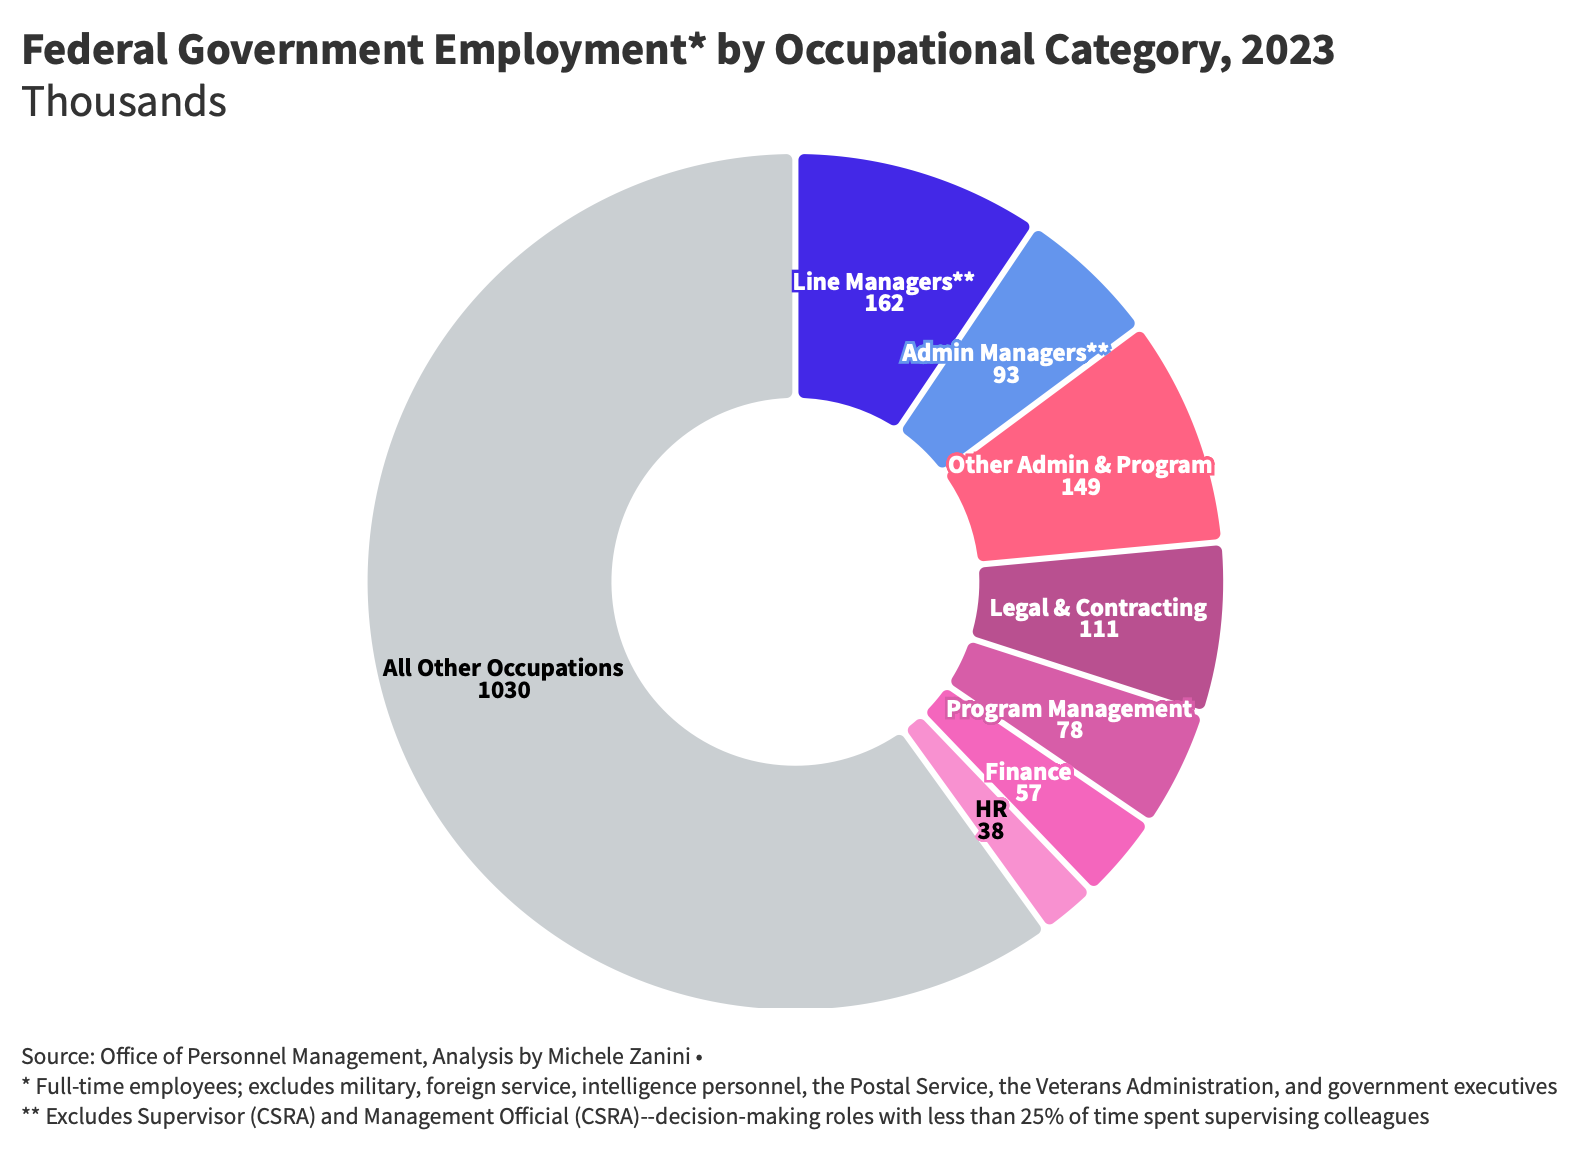
The proportion of managers and administrators in the federal government is double that of the U.S. economy.
TWO: Management and administrative roles account for all federal job growth over the last quarter century. There are about 240,000 more people working full-time for the government in 2023 compared to 1998, a 16% increase (remember, this excludes Veteran Affairs). Managers and staff function roles grew by 262,000 while all other occupations shrank by 18,000.
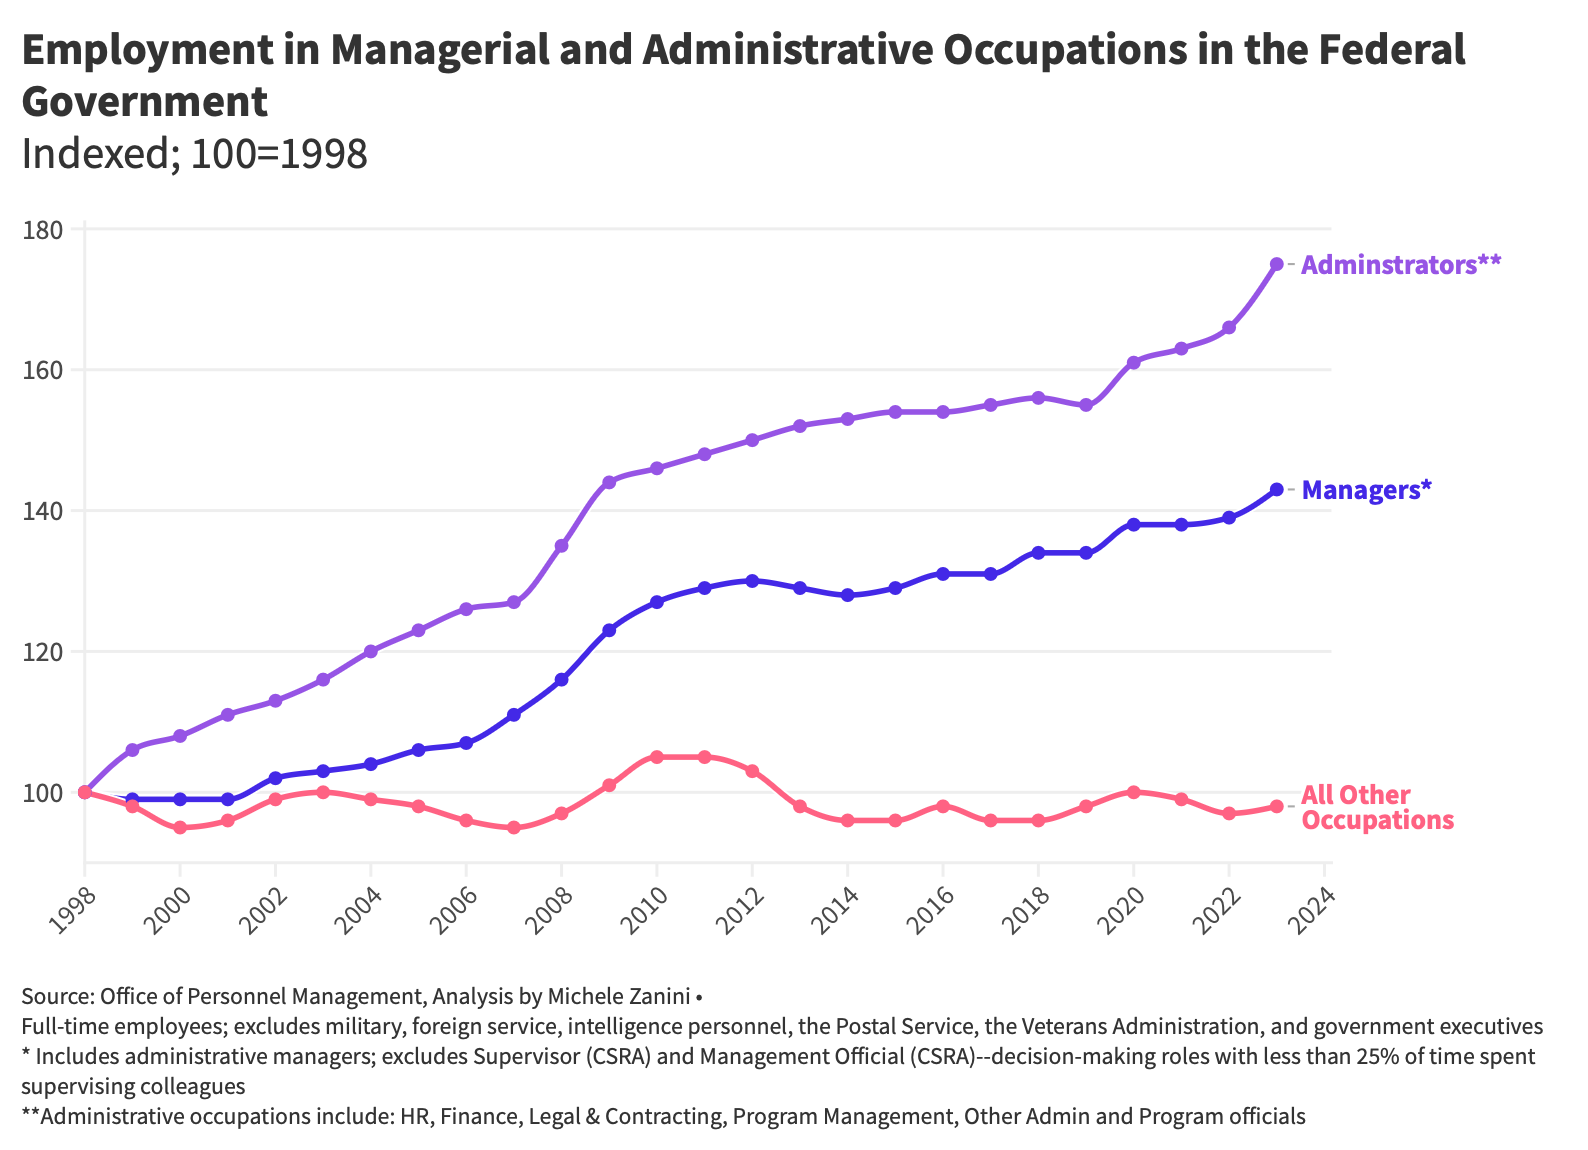
As Francis Fukuyama and others have noted, the federal workforce has grown more slowly than the US population, spending, and GDP. What has expanded rapidly, however, is the number of taskmasters, controllers, accountants, and analysts who are charged with maximizing control and alignment.
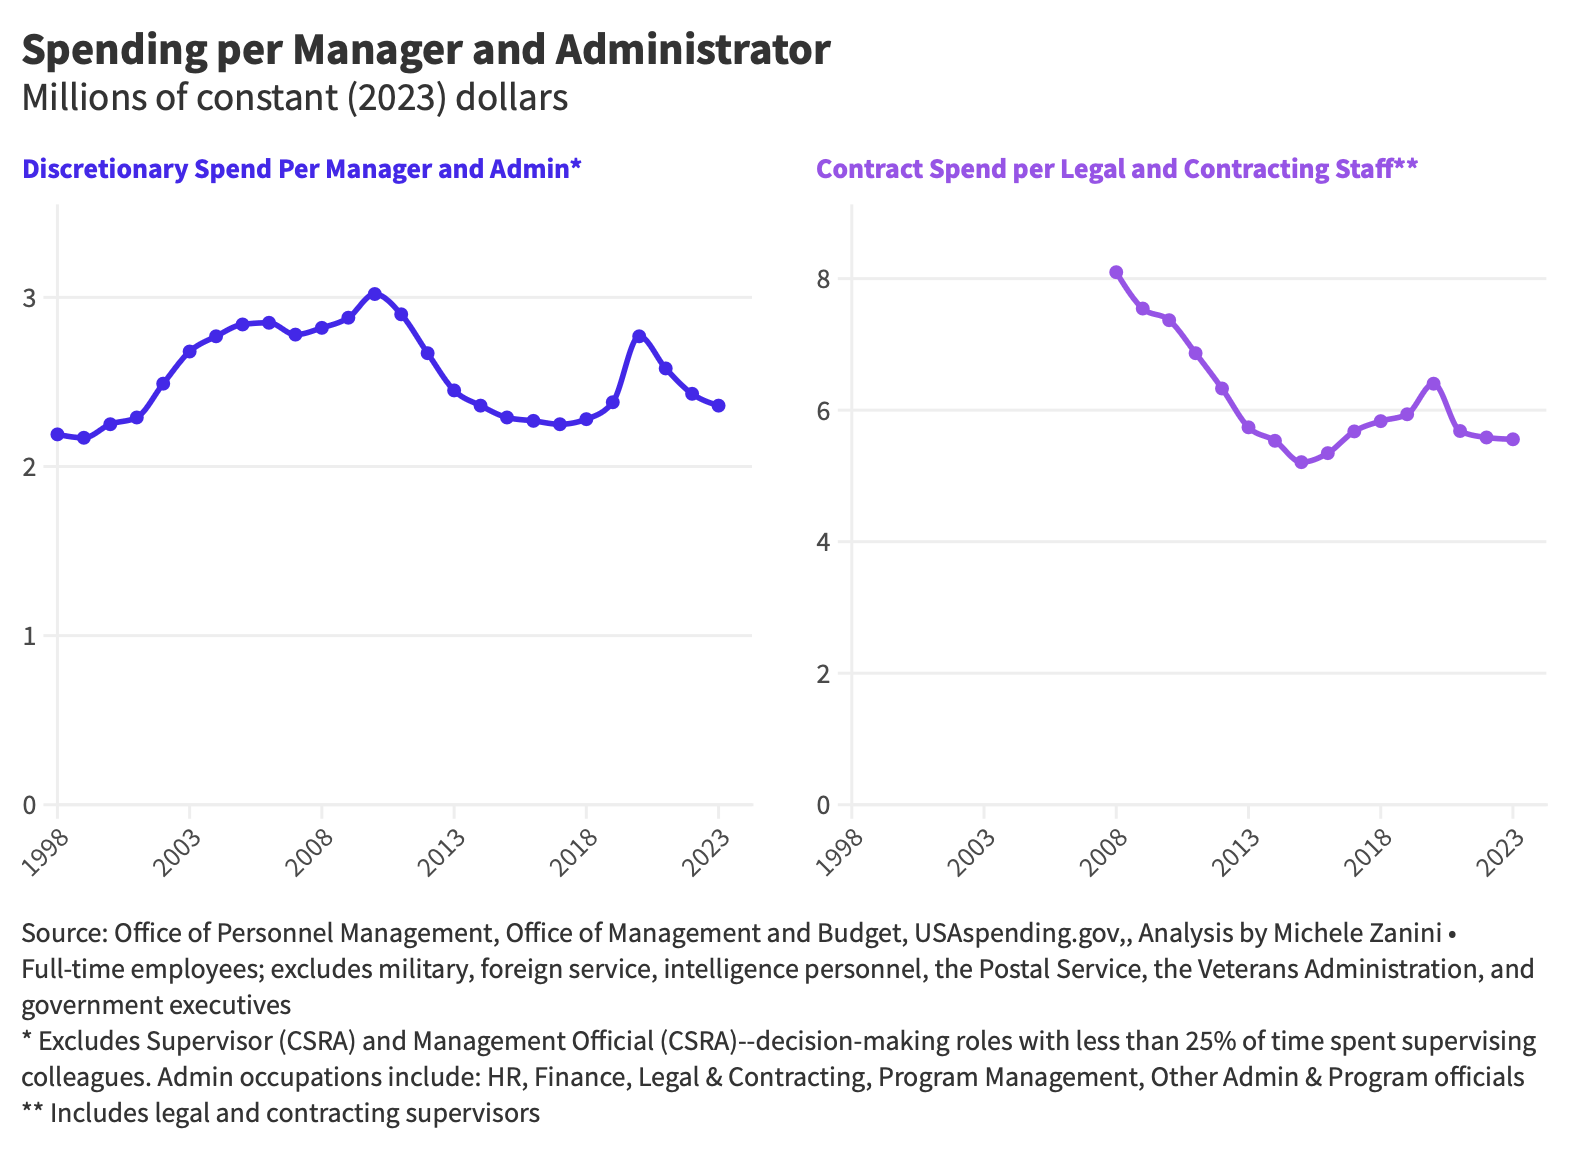
THREE. There’s little evidence of managerial and administrative efficiencies. In fact, the opposite is likely. Discretionary spending (annual funding that Congress must actively approve, such as defense and education) per manager and administrator has been ~15% lower in the last ten years compared to the prior decade. The ratio of contract spend to legal and contracting staff is down by nearly a third since 2008 (the earliest year for which I found government-wide contracting data). The dollar per bureaucrat ratio is marginally better for non-discretionary programs like Medicare or Social Security, but this is likely due to mandated payment increases, especially during the Covid emergency, rather than higher productivity.
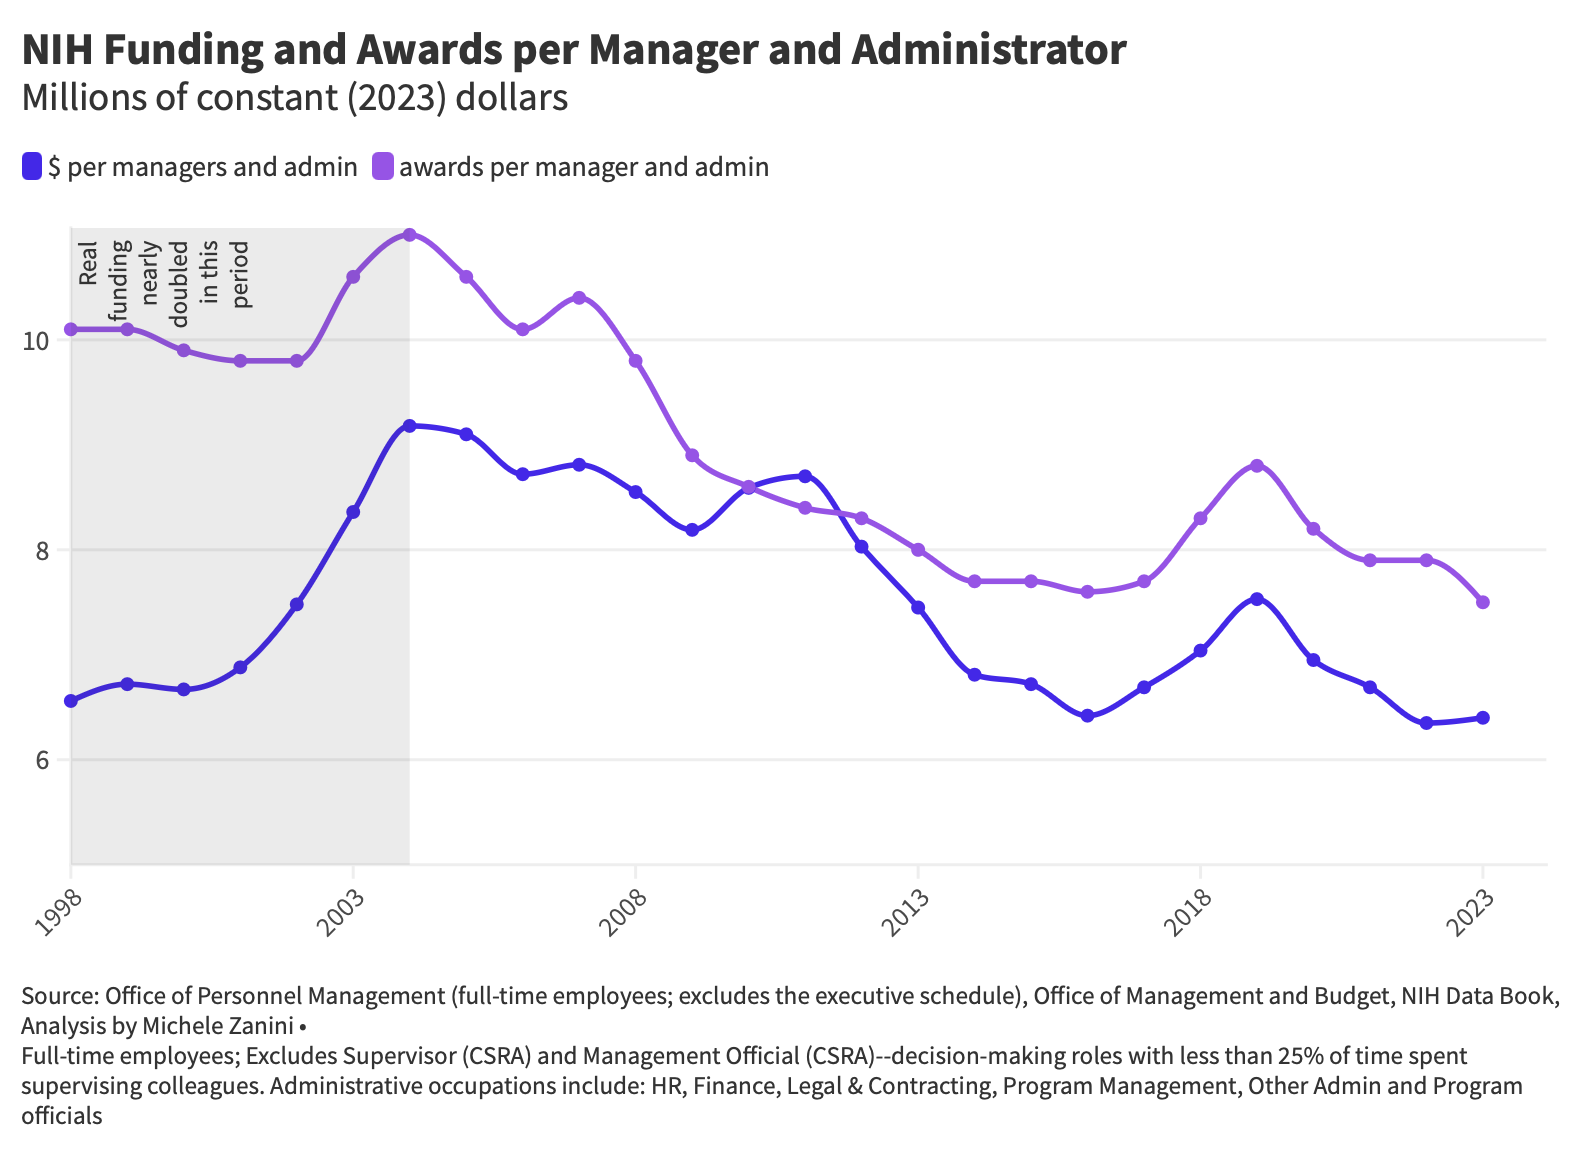
FOUR. At the NIH, the decline in dollars per bureaucrat is ~25%—that’s because managers and administrators there have outpaced funding nearly 3x over the last twenty years. Beyond the extra personnel cost, more managers and administrators mean more layers of approval and more process, which increase friction and unproductive effort across the entire biomedical establishment (federally-funded research faculty spend nearly half of their research time on administrative tasks).
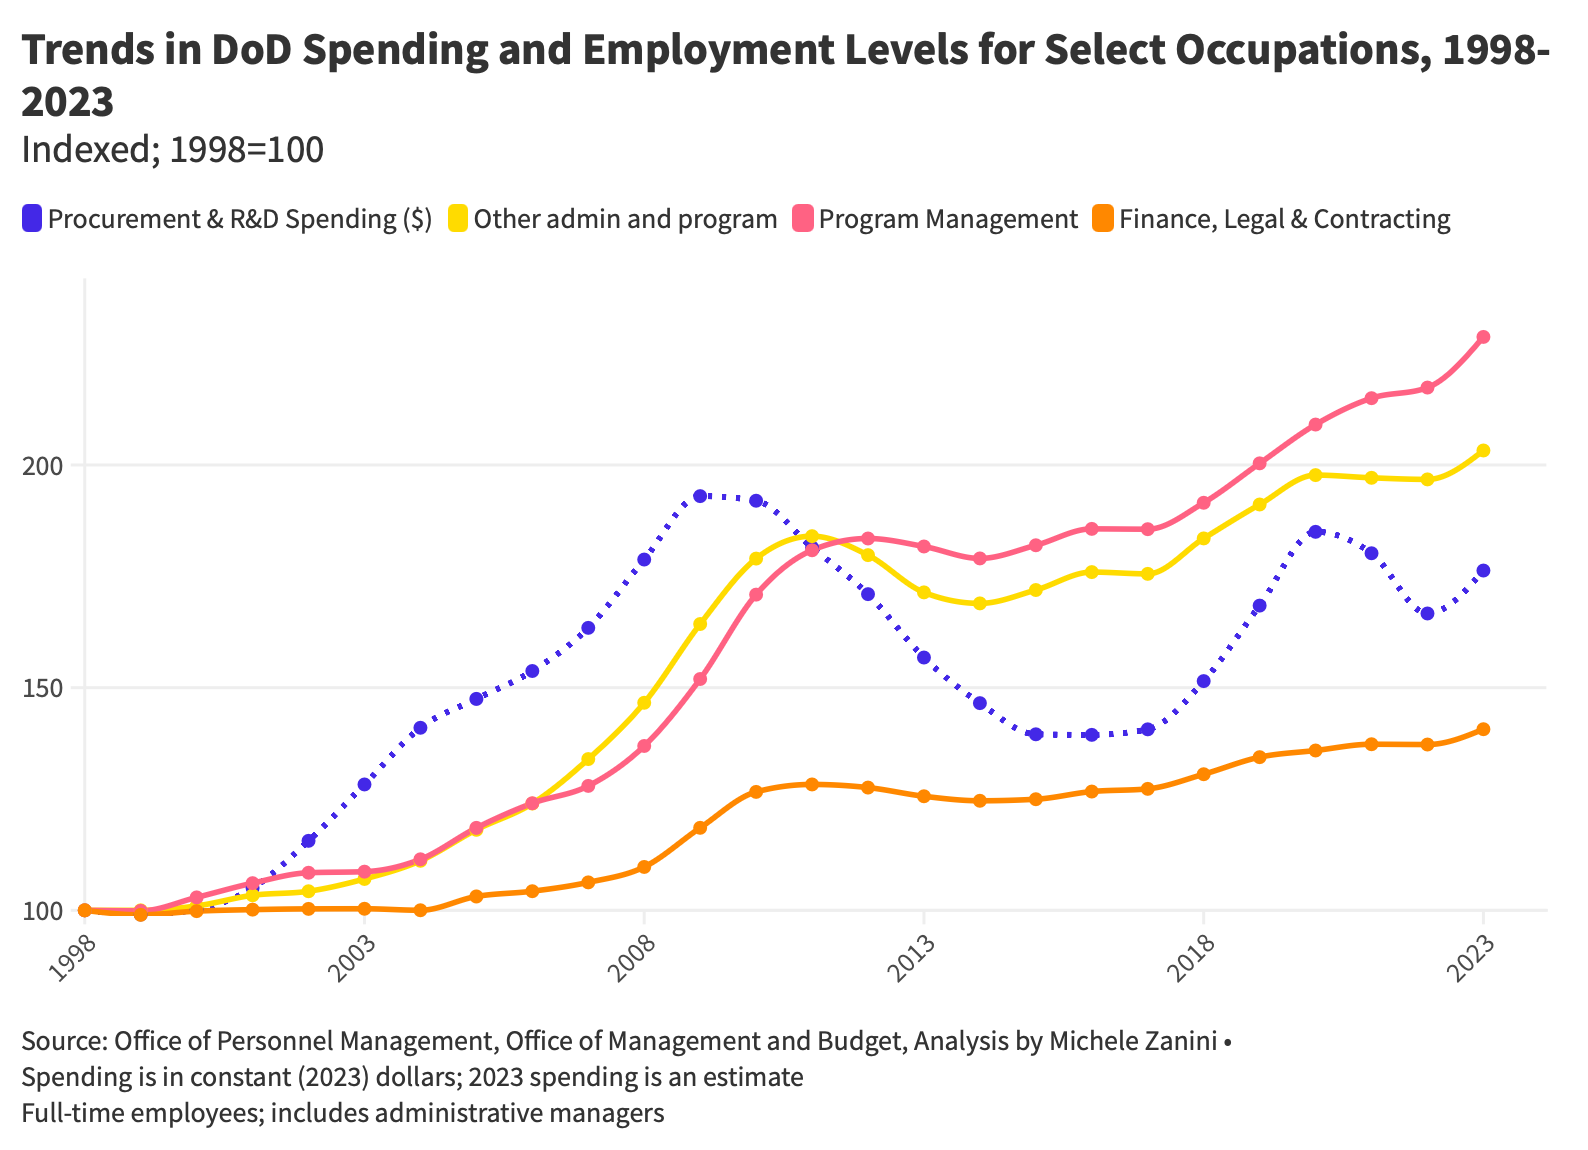
FIVE. The Department of Defense (DoD) fits the pattern. Defense spending fell after Iraq and Afghanistan, yet administrative employment continued to expand (the chart below tracks procurement and R&D dollars). A 2.3x increase in program managers didn’t help bring programs like the F-35 or Littoral Combat Ship under control, and a 40% boost in financial, legal and contracting staff hasn't prevented the Pentagon from failing its audit seven years in a row.
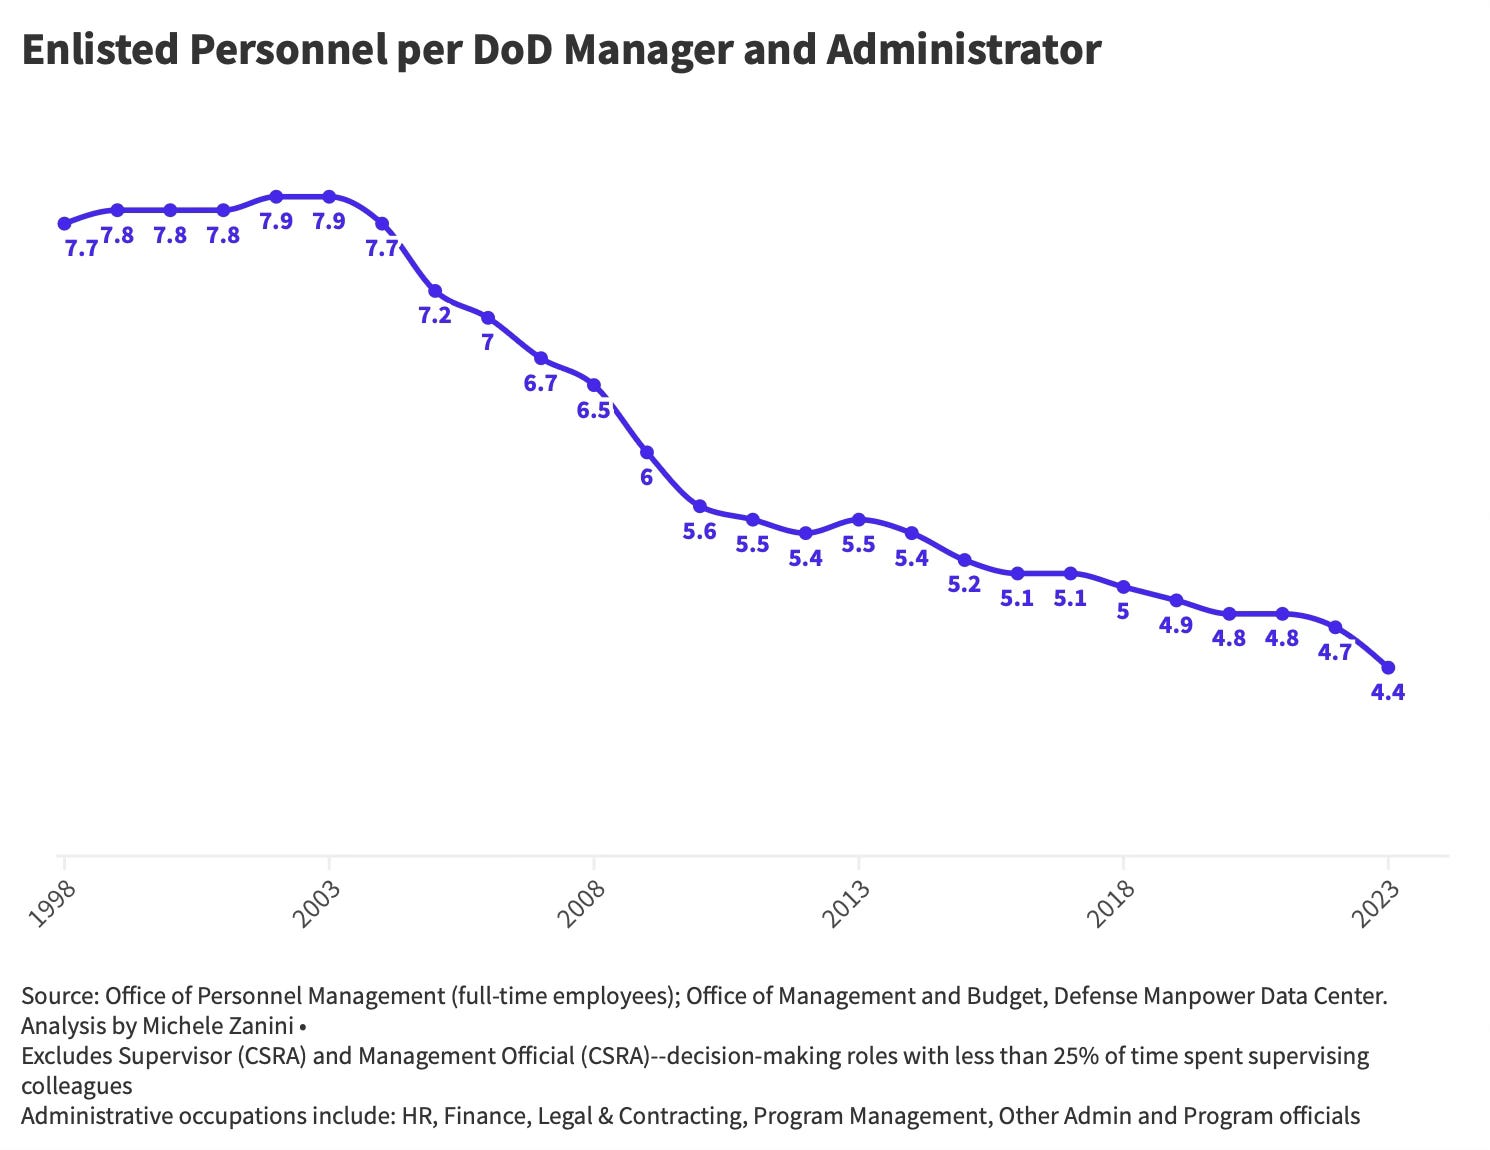
Bonus chart: There are twice as many managers and administrators per soldier than in 1998. The US isn’t alone on this front—the UK Ministry of Defense now has as many civilians as military personnel in the Royal Navy and RAF combined.
Personnel in uniform aren’t immune to this drift, either. A 2018 RAND study found more generals overseeing planning, HR, and finance than leading combat units. The ratio of doers to talkers seems to be declining everywhere.
Administrative occupation trends
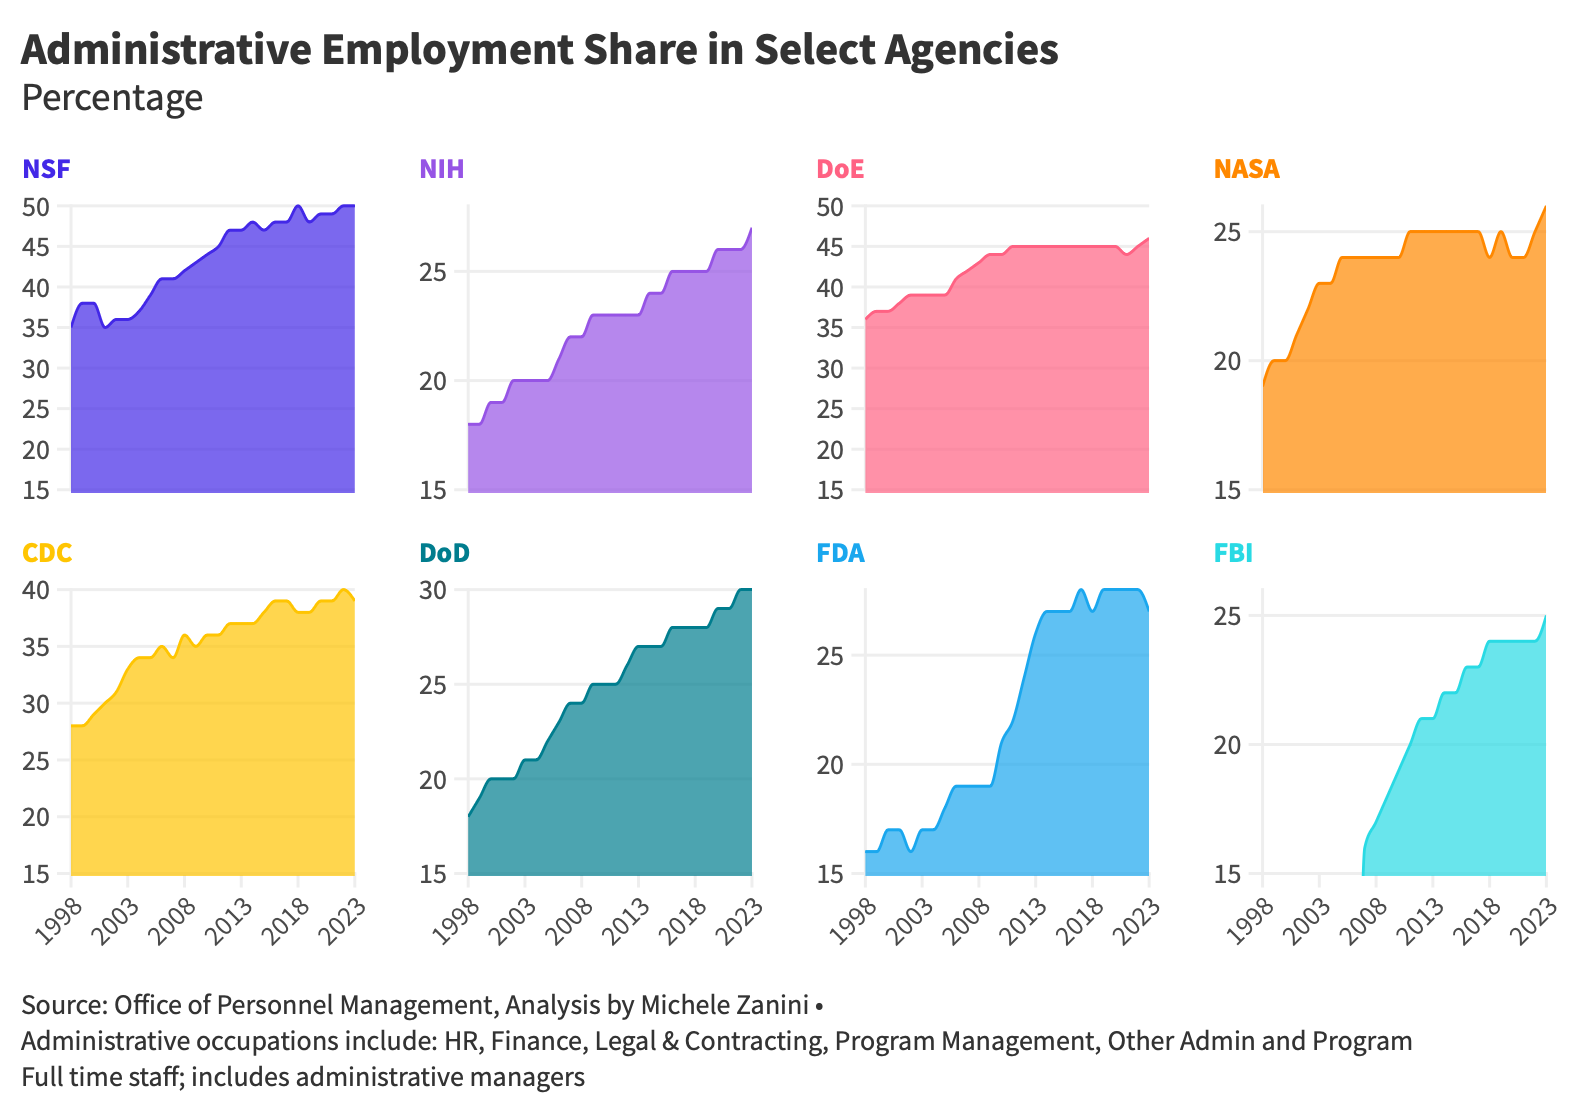
SIX. Administrative growth is pervasive. Employment in staff functions—HR staffers, budget analysts, program managers, coordinators, contracting specialists, lawyers, and related roles—have increased their share employment across agencies (administrator headcounts in this section include administrative managers).
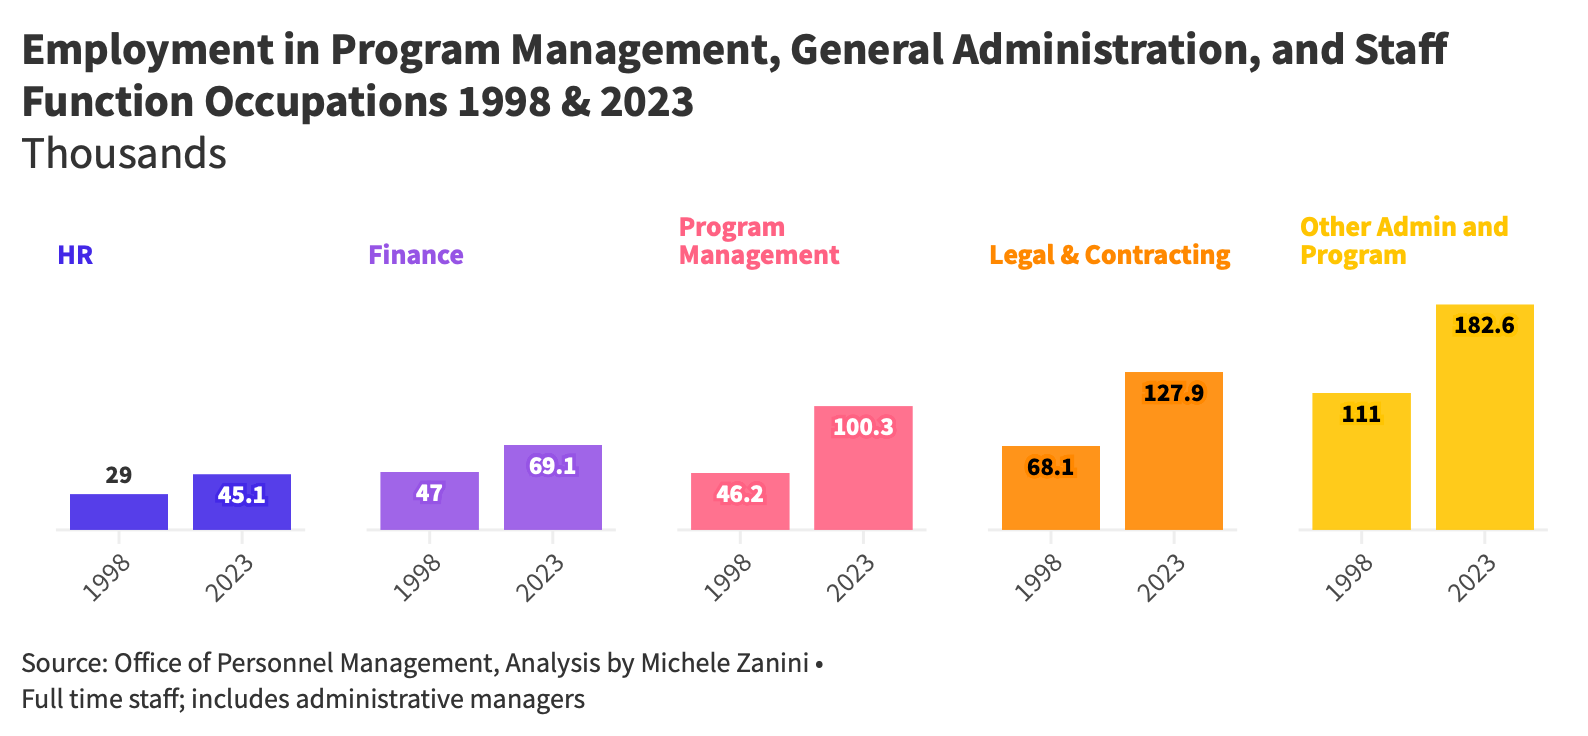
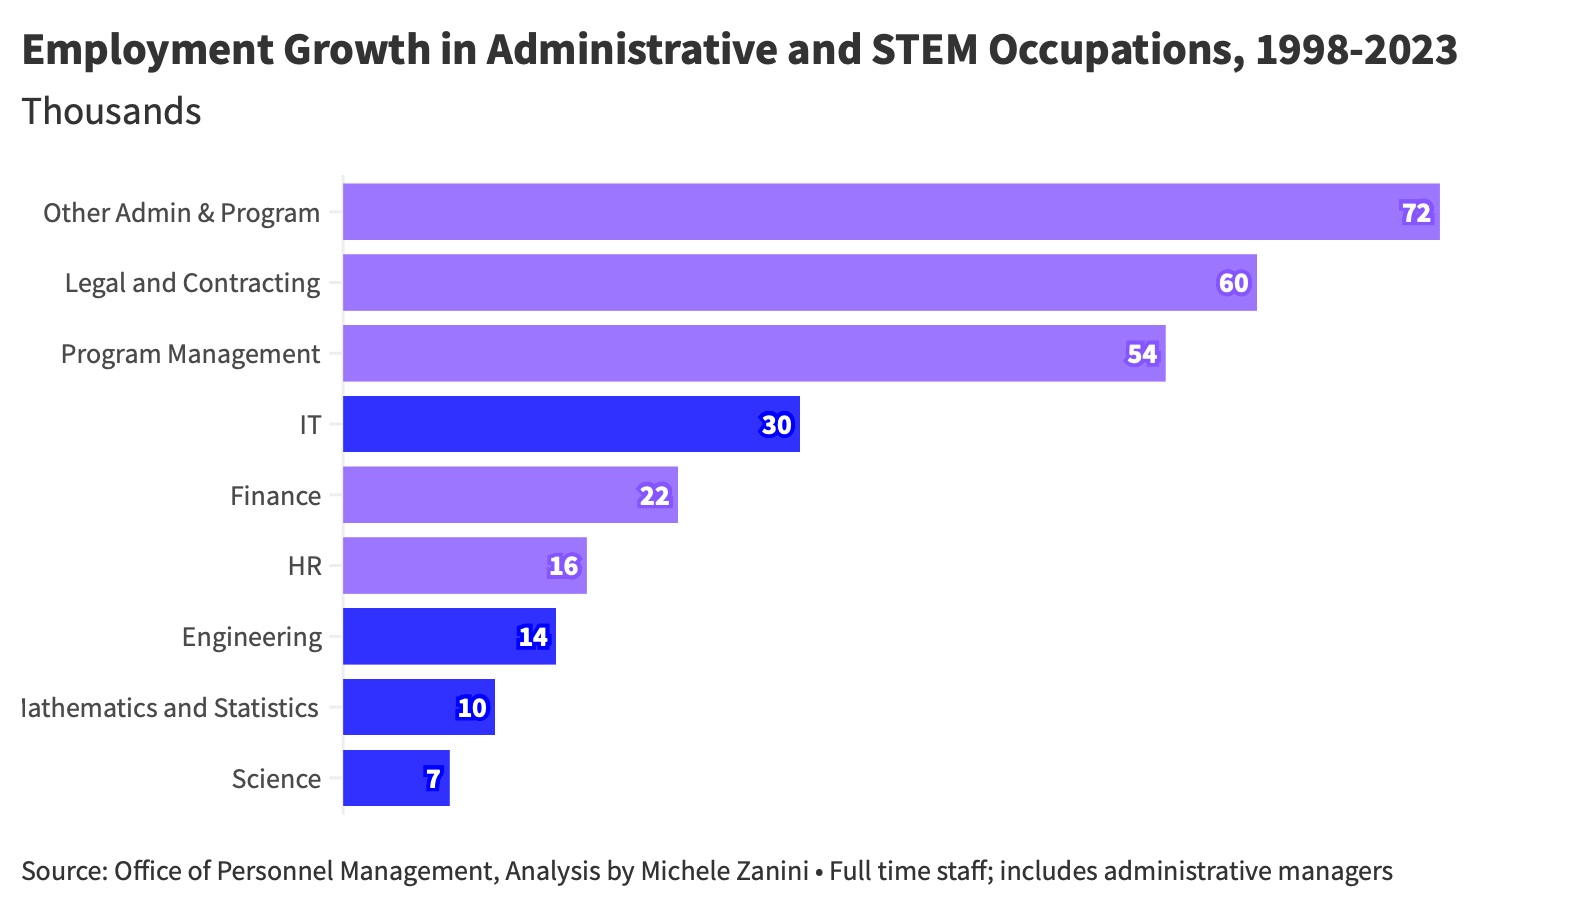
SEVEN. All administrative functions have grown substantially over the last 25 years. Finance expanded by 50%—this during an era of outsourcing, automation, AI, and digital tools that improve accounting and reporting efficiency. Program Management positions had the steepest rise, from 46,000 to 100,000 staff. Legal and Contracting roles grew nearly as much, increasing from 68,000 to nearly 128,000 people—an 88% jump.
EIGHT. The federal government now values administrative over technical skills. Administrative roles grew by 220,000, 3X the growth in engineering, mathematics, science, and IT jobs. The government added more finance and HR specialists than engineers, statisticians, and scientists combined.
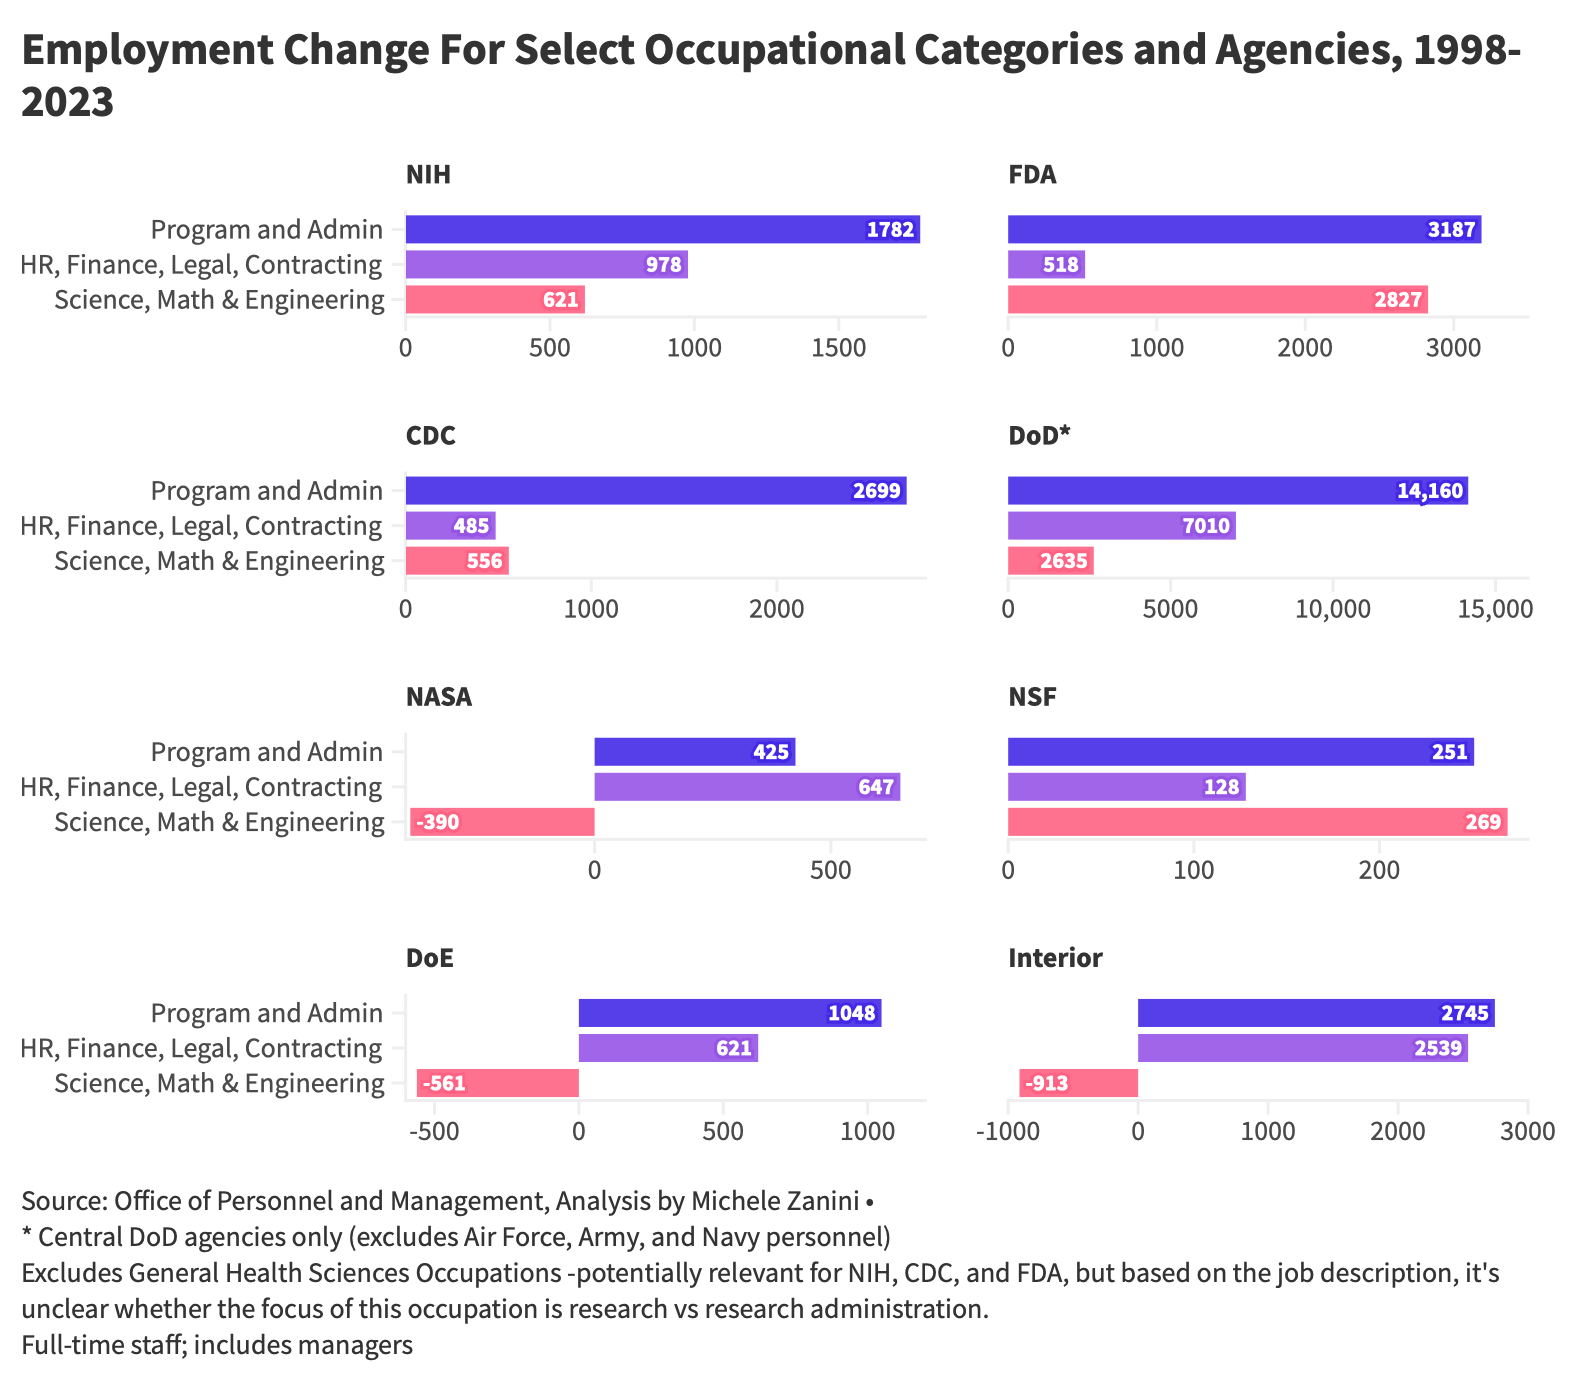
NINE. Agencies that historically relied on scientific and engineering expertise are the most affected—including the NIH, the Food and Drug Administration (FDA), the National Science Foundation (NSF), the Centers for Disease Control (CDC), DoD's central units, as well as NASA.
Management occupation trends
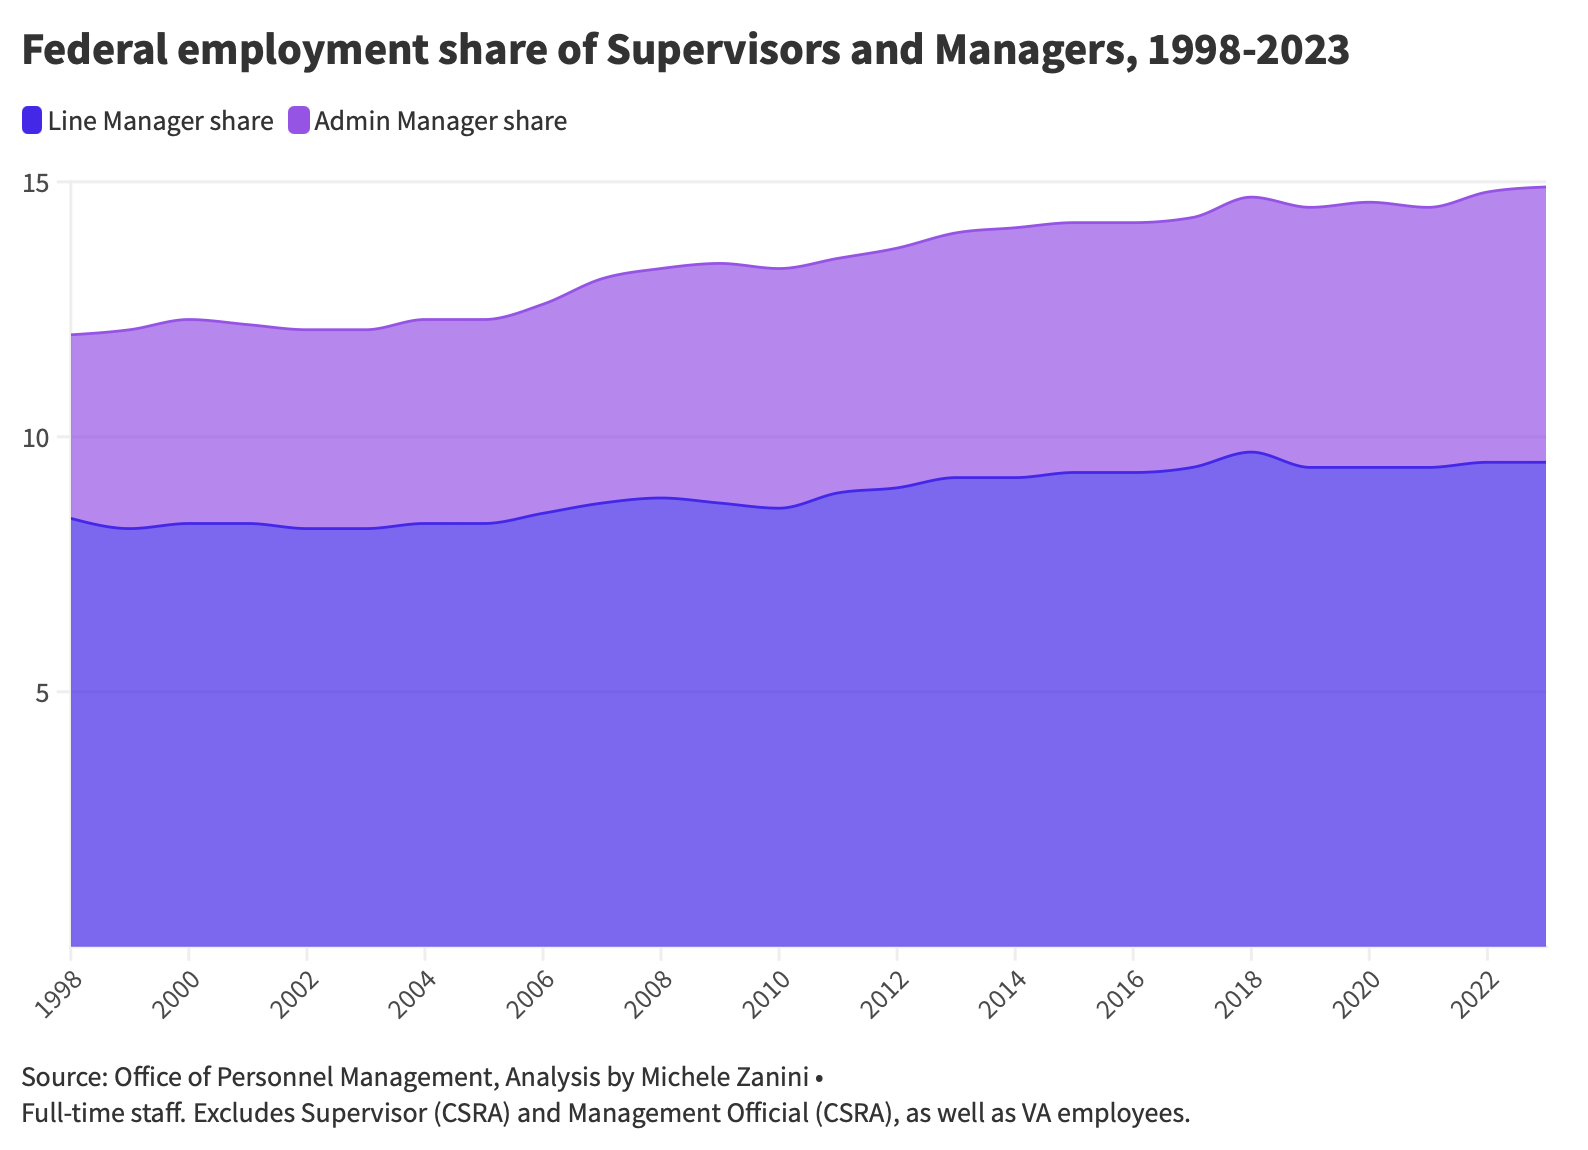
TEN. Management positions now constitute 15% of federal employment. Administrative management roles outpaced line management by more than two to one. There’s little doubt that senior administrators have become more influential over the last few decades.
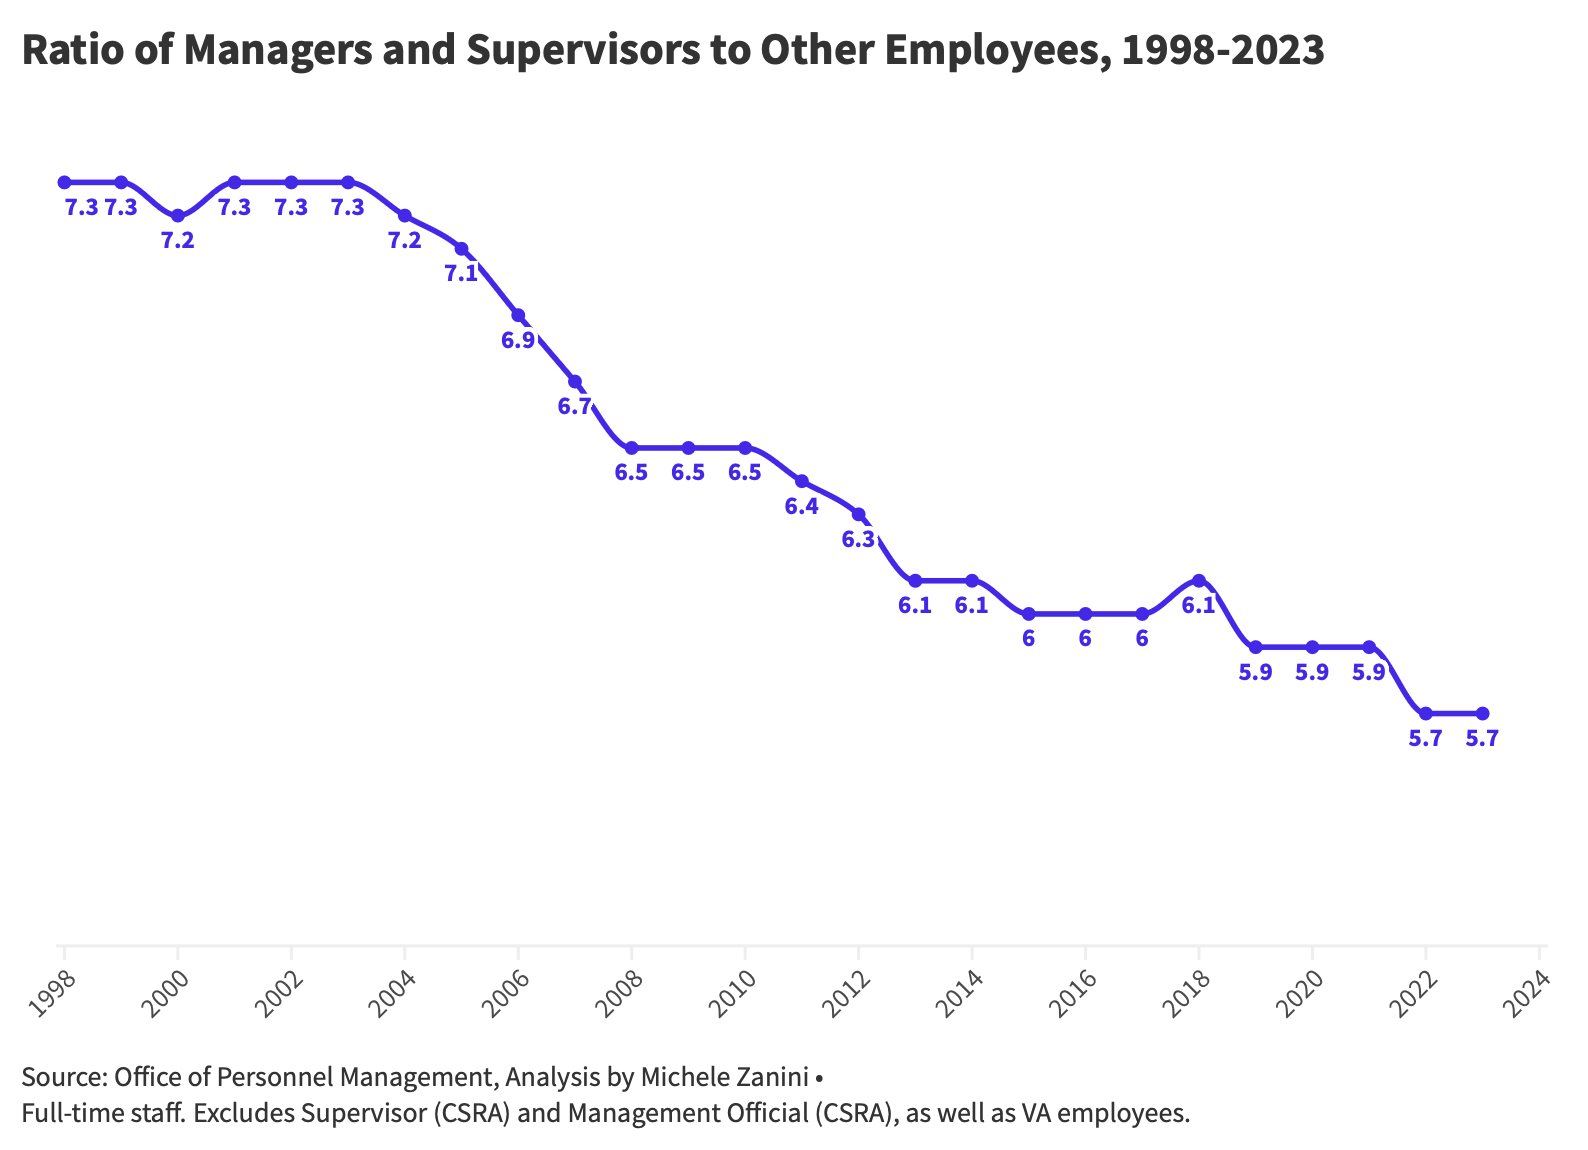
ELEVEN. Managerial growth means that the span of control has shrunk by almost a quarter. Up until the early 2000s, there were 7.3 employees for every manager; that ratio now sits at 5.7.
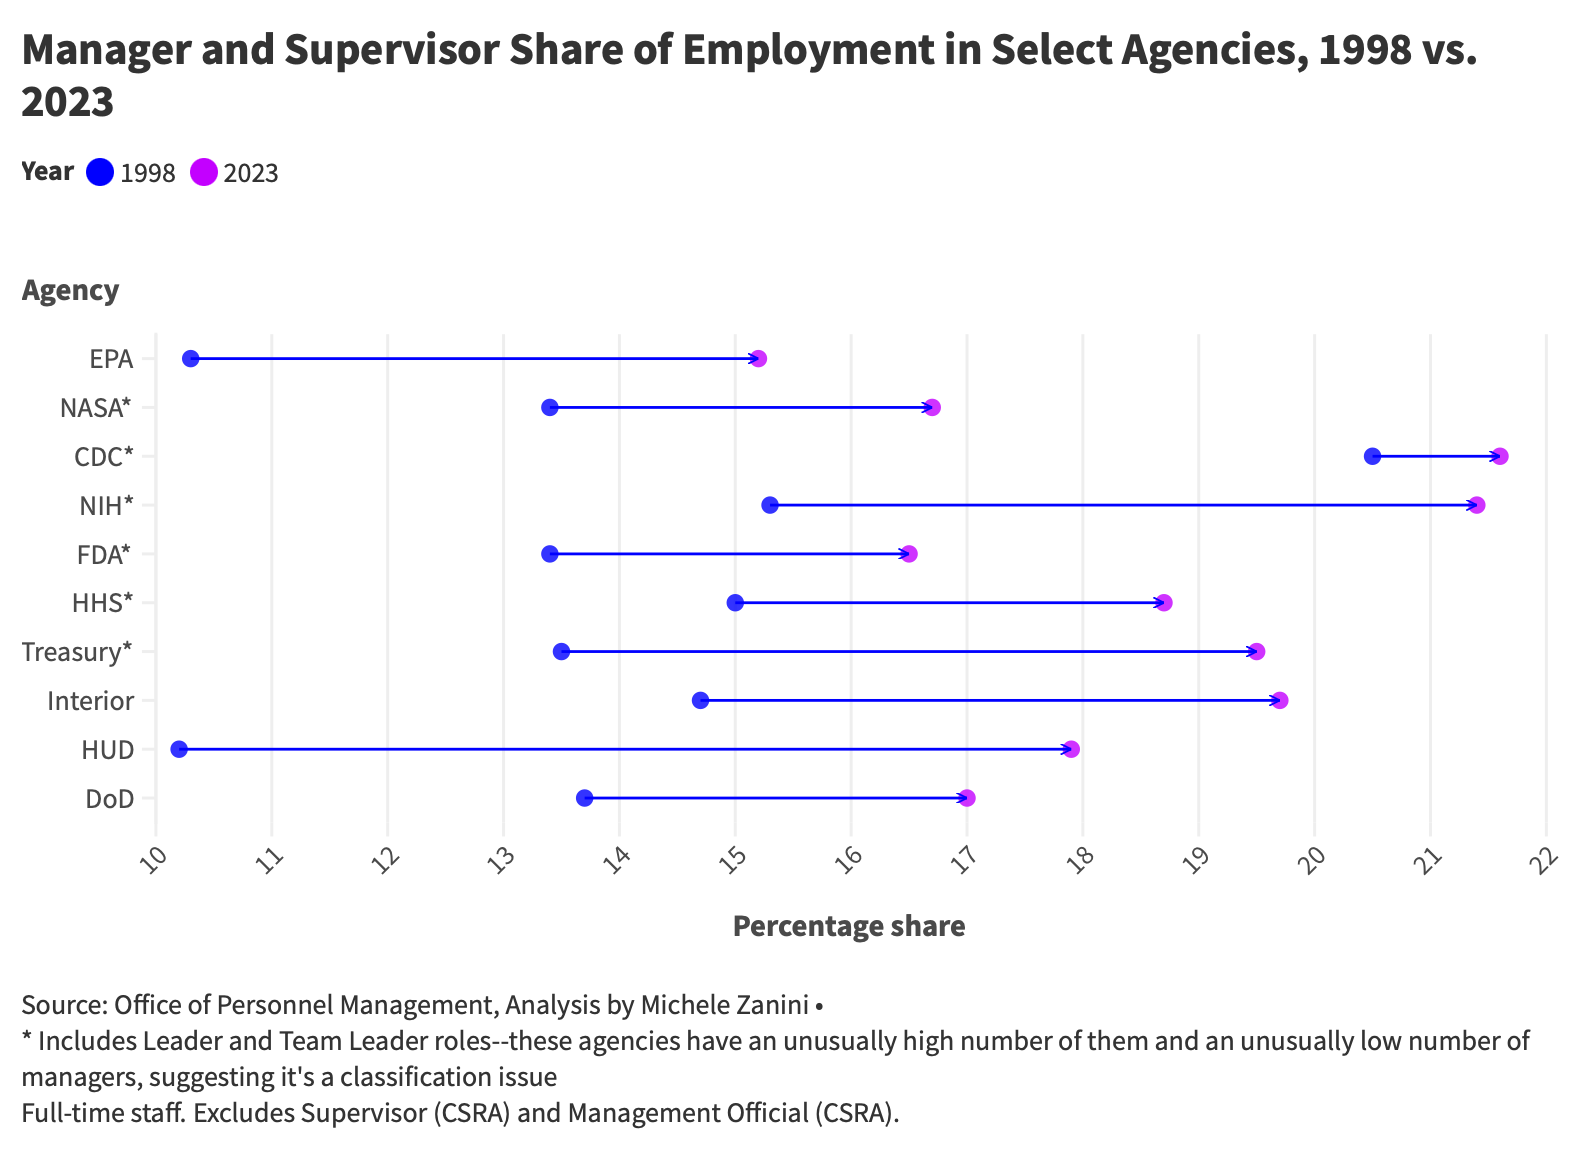
TWELVE. Management ranks have increased across multiple federal agencies. Several of them show a 4-5 percentage point increase in supervisor and manager employment share over the past 25 years. At the NIH and CDC, nearly one in every four employees is a manager.
THIRTEEN. The higher up you are, the better your performance ratings. This chart breaks out non-supervisors into three categories used by the Office of Personnel Management: (1) those with managerial titles but no significant oversight responsibilities (CSRA—a small group of ~40,000); (2) those in 'leader' or 'team leader' roles who guide clerical workers or some professional staff through projects; and (3) all other employees (1.4 million). Merit apparently gravitates to the corner office.
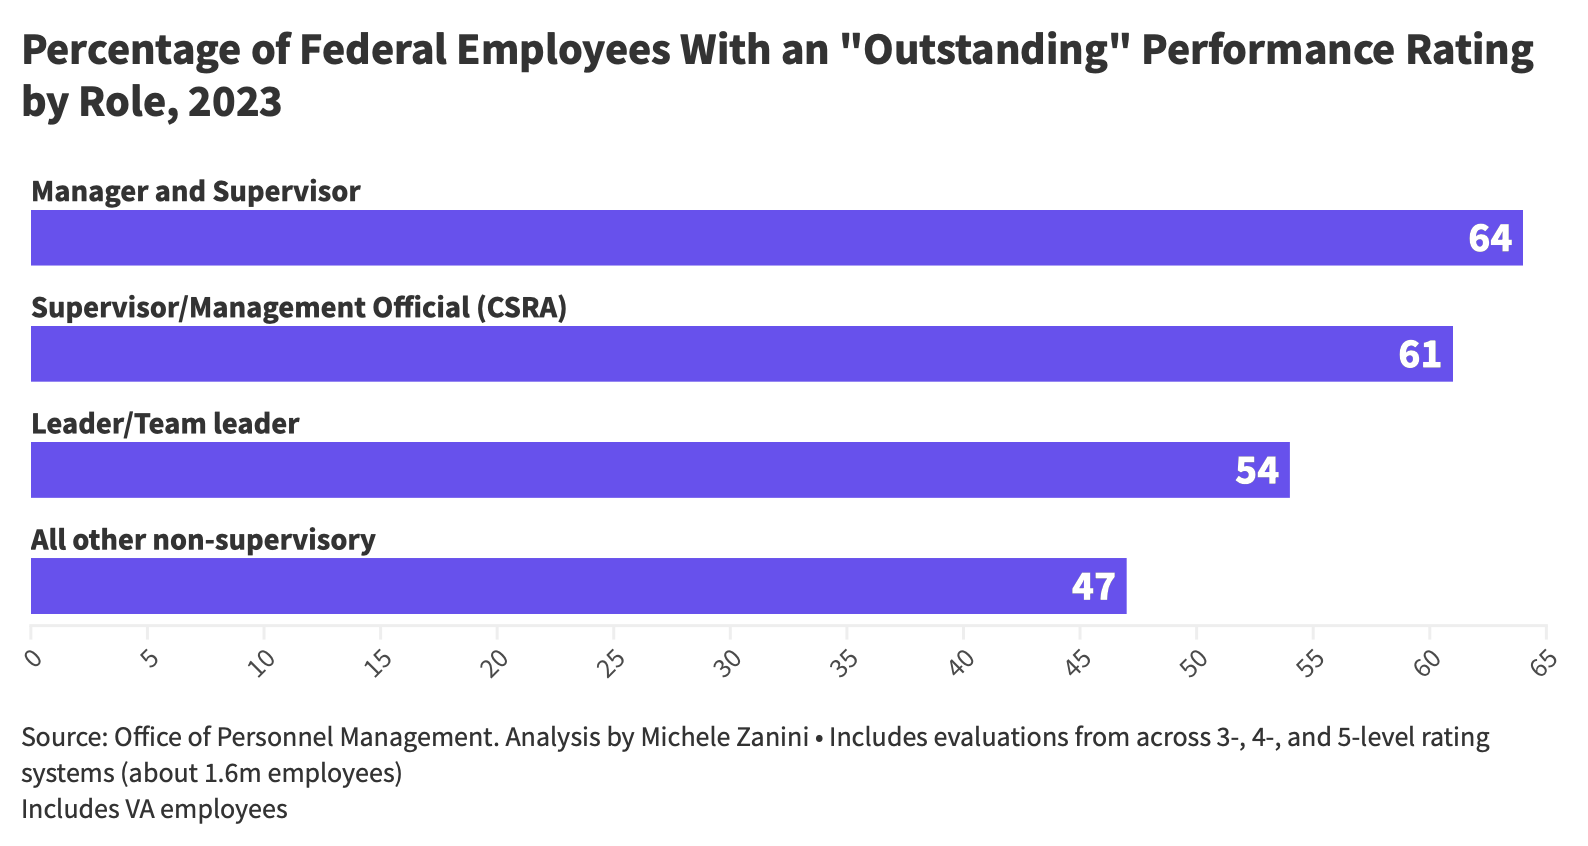
Over time, higher ratings mean more promotions, and a lopsided pyramid. By the way, the fact that more than half of all federal employees have an “outstanding” rating would make Lake Wobegon blush—but that’s a topic for another day.
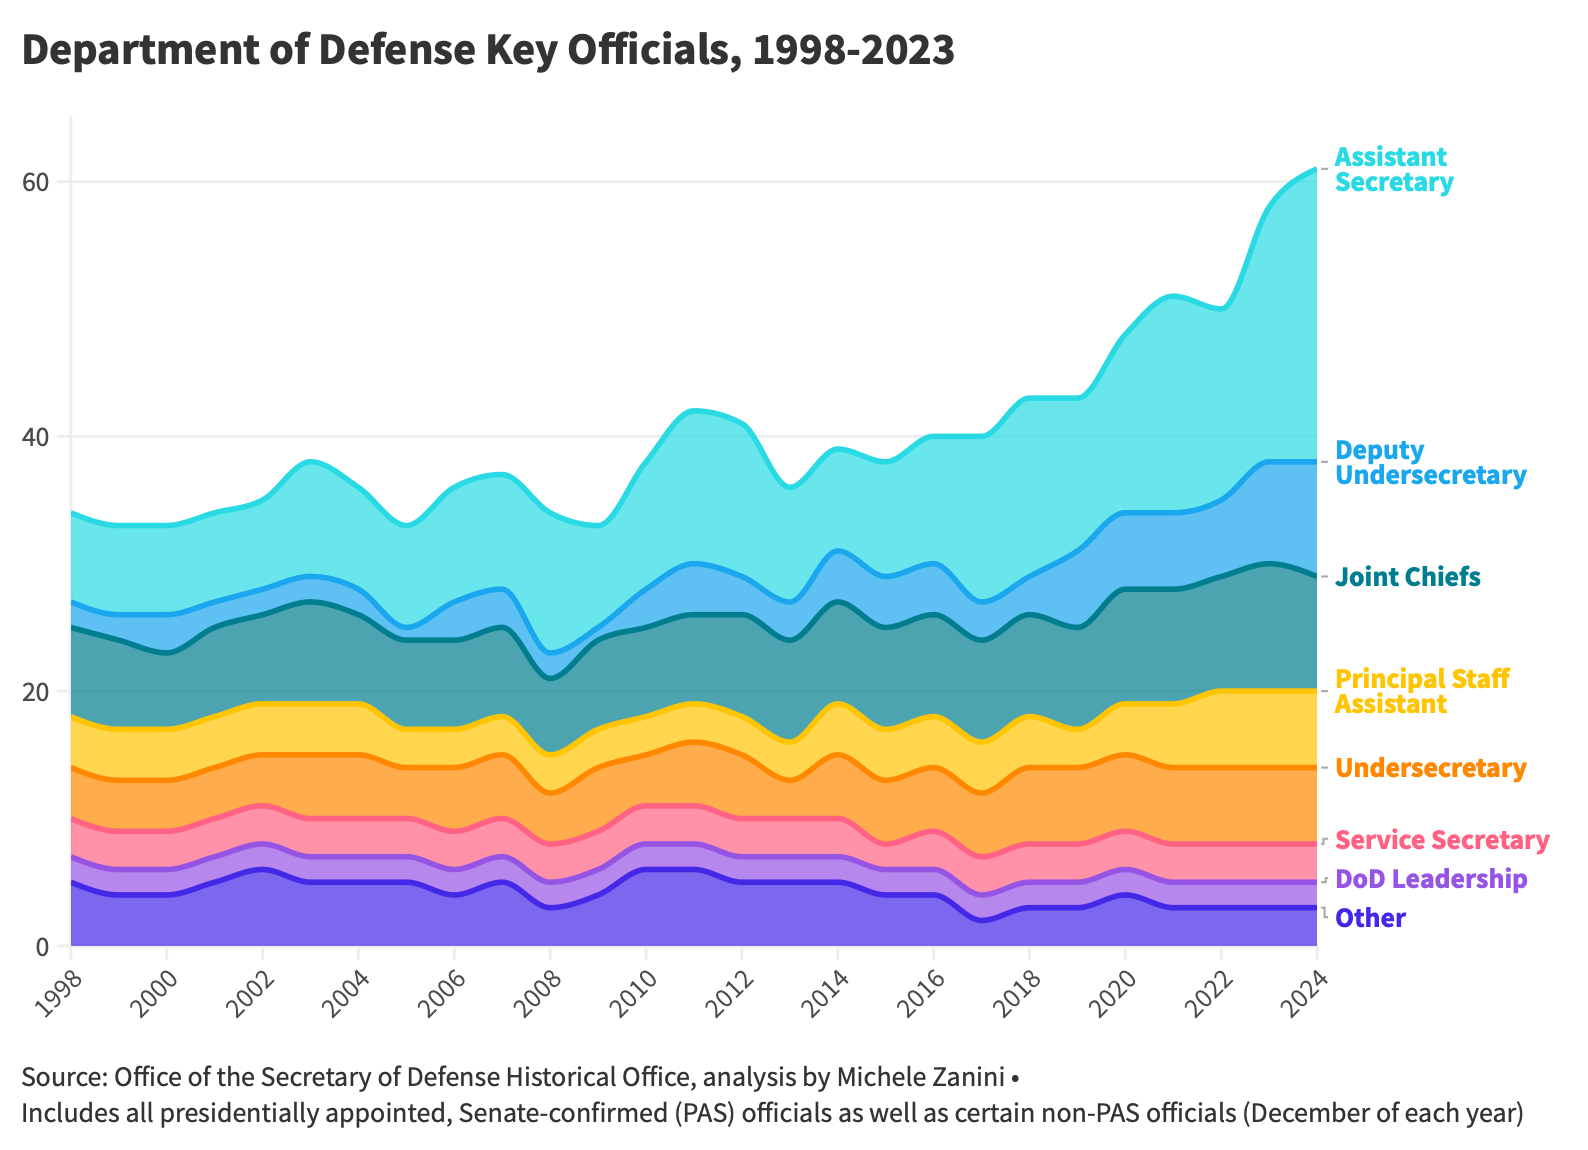
FOURTEEN. Managerial growth is strongest at the very top of the pyramid. According to New York University professor Paul Light, there are nearly five times more organizational layers among executive roles in the federal government relative to the 1960s. Consider the expansion of leadership positions at the DoD— from 34 to 61 in the last 25 years. Each new Assistant Secretary or Deputy Undersecretary generates cascading layers of subordinates—Principal Deputy Assistant Secretary, Director, Deputy Director, Assistant to the Deputy Director, and so on. These roles are rarely eliminated.
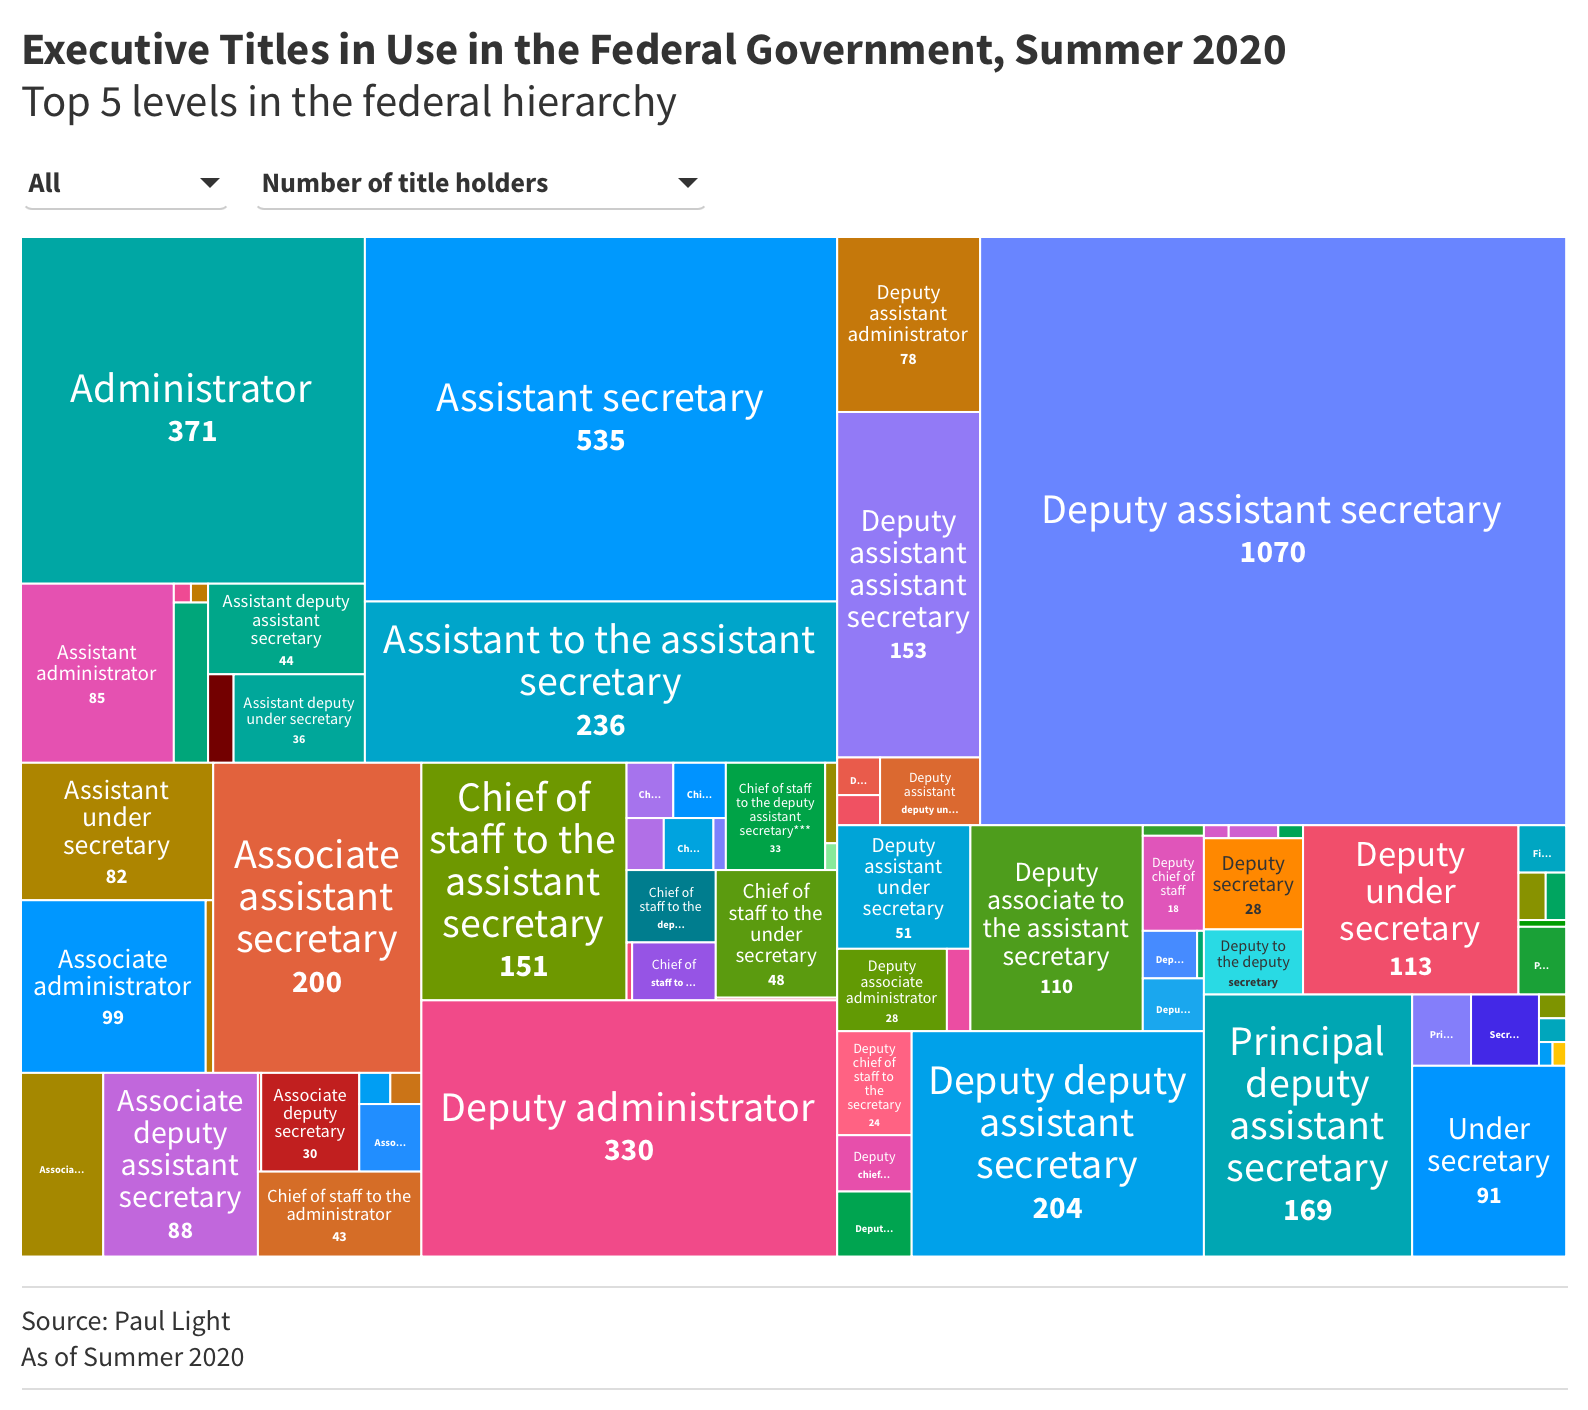
FIFTEEN. As a result, the executive hierarchy has spawned a bewildering tangle of titles. Professor Light’s 2020 count found 1,070 deputy assistant secretaries, 236 assistants to the assistant secretary, 204 deputy deputy assistant secretaries, and 153 deputy assistant assistant secretaries (click here for an interactive version of the chart).
We'll leave the accounting of the toxic effects of this byzantine, multilayered hierarchy to another post, but it’s easy to see how it slows down decision making, degrades decision quality, and diffuses accountability.
And these senior-most positions are just the start. Multiple layers separate VA nurses, park rangers, and FBI agents from their organization's apex. Back in 2010, DoD Secretary Gates lamented that there were up to 30 layers between himself and an action officer on the ground.
In sum, the federal workforce has grown modestly but its composition has shifted fundamentally over the past quarter century. The managerial hierarchy has both expanded and thickened, while administrative staff functions have multiplied and crowded out operational roles, including in STEM disciplines. In several agencies, this bureaucratic growth has outpaced the very budgets these positions oversee.
Question is, what accounts for this growth? We’ll tackle that question in the next essay.
Methodology
This analysis was made possible by the support of the Office of Personnel Management (OPM), which helped me assemble a detailed dataset on the federal workforce over time (a great example of responsive government!). A few notes on scope:
The OPM numbers do not include military, foreign service, intelligence personnel, the Postal Service, and the presidentially-appointed government executives (though charts 14 and 15 addressed this last group).
With one exception, the Veterans Administration is also not part of the analysis, as its supervisory role data shows inconsistencies over time.
The manager count doesn't include 45,000 federal employees with managerial titles who don't directly supervise staff. Under federal employment classifications established by the Civil Service Reform Act of 1978 (CSRA), there are two distinct roles that sound managerial but aren't fully supervisory: (1) CSRA Supervisors can make some personnel decisions but have limited authority compared to full supervisors (who must spend at least 25% of their time on supervisory duties), while (2) CSRA Management Officials “shape organizational policies” but don't supervise staff.
My approach to categorizing administrative occupations differs from OPM's—they include operational roles like park rangers, FBI agents, IT specialists, and compliance officers, which are excluded here (I do include certain legal and financial positions that OPM designates as 'professional' into the administrative class).
These choices produce conservative estimates of both managerial and administrative positions.